Lennart Schulenburg
VisiConsult X-ray Systems & Solutions GmbH, Stockelsdorf, Schleswig-Holstein, Germany
Copyright 2018 VisiConsult X-ray Systems & Solutions GmbH
abstract
Additive manufacturing (AM) offers new possibilities in manufacturing and designing products. The aerospace and automotive industry is a main driver because of the possibility to manufacturing lighter structures that reduce weight and save fuel. During the manufacturing process different discontinuities or defects can occur, depending on the applied AM technology. To ensure constant manufacturing quality of the parts regular sampling or 100% inspection using non-destructing methods are required. Particularly Computed Tomography (CT) allows a contactless investigation and different analysis methods (nominal-actual comparison, porosity analysis, wall thickness analysis, etc.). As an advantage to other methods it can even evaluate parts with a very complex inner structure. Different AM parts were scanned to verify CT analysis methods and show the diversity. The following paper gives an overview about the AM technology, particularly selective laser melting, the occurring defects and their possible causes. Furthermore, the functionality of a computed tomography system and the reconstruction process get explained. Different kinds of analysis are shown in a few examples on AM parts and the limits of this testing method as well.
Keywords: Computed Tomography, X-ray, Digital Radiography, Industry 4.0, Additive Manufacturing, CT, AM
- INTRODUCTION
Additive Manufacturing (AM) is defined as “the process of joining materials to make objects from 3D model data, usually layer upon layer, as opposed to subtractive manufacturing methodologies, such as traditional machining”. [1] The first form of creating a three-dimensional object using computer-aided design (CAD) was rapid prototyping, developed in the 1980’s for creating models and prototype parts. Rapid prototyping is one of the earlier additive manufacturing processes. [2] Compared to the traditional, subtractive manufacturing processes like milling, drilling and turning AM offers distinct possibilities. The subtractive techniques start with a block of the basic material, which is then subtracted from until the final desired product is reached, leaving much of the initial block as wasted scrap. In the AM process, the part is constructed by depositing material layer by layer in the Z-direction until the final product is produced, leaving little to no waste. [3]
This offers a new freedom in the design of products. There are a variety of applications in the medical field that allows individual adaptation to the human body. Furthermore, there is an enormous interest in the automotive and aerospace sector, because it’s possible to create complex structures in a one-piece design and integrate functionalities or redesign products to save weight without sacrificing stability. In addition, in many cases this process is more economical than traditional methods, due to reduced tool and storage costs.
Now, with the desire to use this technology, the fist concerns arose. There are a lot of internal or regional standards and guidelines for casting and welding products. It is regulated which defects can occur and with which methods this is to be checked. But what about the AM products? The methods are diverse and differ greatly, seen in figure 1. Just as diverse are the types of defects that can occur such as pores, cracking, inclusions, delamination, lack of fusion, undercuts or trapped powder, just to name a few. With advanced in the AM technology, there must be an increase in quality control of the AM parts to ensure their structural integrity. [3] The paper discusses the applicability of the non-destructive computed tomography technique to evaluate defects in AM parts and which analyses can be used especially for the selective laser melting (SLM) process for metals.
- AM TECHNOLOGIES AND DEFECT
The AM process starts with a computer-aided design (CAD) model that gets sliced into individual layers using software that generates instructions, known as G-code, which are sent to the AM machine. [3] In Figure 3, there is an overview of the different additive manufacturing processes.
The criterion used is to classify these processes into liquid base, solid based, and powder based. The shown processes are selective laser sintering/melting (SLS/SLM), electron beam melting (EBM), 3D printing (3DP), binder jet AM (BJAM), laminated object manufacturing (LOM), Ultrasonic AM (UAM), adhesive coated laminates, fused deposition melting (FDM) stereolithography (SL) and Polyjet. The liquid-and powder-based processes seem more promising than solid-based processes of which LOM is the predominant one today. In 2004, EBM, Prometal, LENS, and Polyjet were nonexistent. [4] Here we will be focused on the selective laser melting process.
2.1 Selective Laser Melting (SLM)
This process is based on manufacturing components using metal powders (with a range of 10 to 45 µm) that are melted through, selectively exposing a desired area to a focused laser beam. The laser beam is moved over the build area through mirrors affixed to a galvanometer, as schematically shown in Figure 2. In recent years, machine manufacturers have introduced systems that incorporate two to four laser sources, each with its own independent mirror galvanometer set to enhance the build speeds. The addition of powder for the next layer occurs through a recoater mechanism that traverses the build area and has a piston gravity feed. SLM processes occur within an inert environment, such as argon or a buffer gas, to prevent reactivity of the alloying elements in the liquid state with environmental impurities. Additionally, SLM processes have the capability of building components in a heated powder bed, with the temperatures reaching several hundred degrees Celsius. Heated powder beds are favourable for reducing the buildup of residual stresses during the fabrication of a component however, at the current temperatures, this is applicable only to lower melting point alloys. [3]
2.1 Types of defects in metal AM parts
Common discontinuities observed in material fabricated through metals AM include lack of fusion (delamination) shrinkage porosity, gas entrapped porosity, cracking, thermal distortion, warpage and swelling. Lack of fusion discontinuities arise when a newly deposited layer of powder is not adequately heated and, in turn, melted. This prevents the fusion of the new layer with the underlying solid layer. [3] Shrinkage porosity is a discontinuity that occurs when the liquid metal available during solidification is not able to compensate for shrinkage/density changes as the material undergoes the liquid to solid phase transformation. [5] The identifiable characteristics of shrinkage porosity include an elongated void containing secondary dendrite arms within the void. In the powder-bed processes, entrapped gas porosity is spherical in shape. It is the result of trapped gas within the powder feedstock that cannot escape the melt pool because of the rapid solidification conditions that Occur in metal AM Builds [6]. In SLM process, part warpage occurs due to a buildup of residual stresses within the part. This causes distortion in the part geometry because the stress relaxes when the part is removed from the build plate. Cracking in metals fabricated through SLM processes may occur due to the sensitivity of the material to strain age cracking. This is attributed to the precipitation of secondary phases or solidification cracking at the high solidification rates observed in AM processes. [7]
- COMPUTED TOMOGRAPHY
3.1 CT Setup
In relation to performance, a CT system can be considered as comprising four main components: the X-ray source, detector, sample manipulation stages (the latter including any mechanical structure that influences image stability) and reconstruction/visualisation system. [8]
In the majority of cases the source and detector will be fixed while the sample rotates in the beam to acquire the necessary set of projections. Most industrial CT systems will use an electrically generated X-ray source, which can be subdivided in nano-, mirco- or minifocus tubes, depending on the focalspot size or in open tubes, closed tubes and linear accelerators, depending on the technology. The energy range value in the industrial sector extends from the double-digit kilovoltage to lower megavoltage values.
A radiation detector is used to measure the transmission of X-rays through the object along the different ray paths. The purpose of the detector is to convert the incident X-ray flux into an electrical signal that can be handled by conventional electronic processing techniques. [8]
For example, a high‑resolution CT system (small X-ray focal spot size) may have a considerably lower flux output at more modest resolution settings than one designed to operate at such resolution. Furthermore, a high-performance rotation stage for a high‑resolution scanner will have a much smaller load limit. Similarly, a system designed for high energy imaging will require a thicker phosphor screen, giving poorer resolution compared with a thinner screen, which is adequate at lower energies. [8]
3.2 CT Process
During a CT scan, multiple projections are taken in a systematic way: the images are acquired from a number of different viewing angles (Figure 3). Feature recognition depends, among other factors, on the number of angles from which the individual projections are taken. The CT image quality can be improved if the number of projections of a scan is increased. [8]
The main step is the reconstruction process of these images, which distinguishes this examination technique from other radiographic methods. A computer reconstructs the volume of that stack of projections and an image of a cross-sectional plane (slice) through an object (Figure 4). The resulting cross-sectional image is a quantitative map of the linear X-ray attenuation coefficient, μ, at each point in the plane. The linear attenuation coefficient characterizes the local instantaneous rate at which X-rays are removed during the scan, by scatter or absorption, from the incident radiation as it propagates through the object. [9]
This radiographic method can be an excellent examination technique whenever the primary goal is to locate and quantify volumetric details in three dimensions. In addition, since the method is X-ray based it can be used on metallic and non-metallic samples, solid and fibrous materials and smooth and irregularly surfaced objects. Furthermore, this kind of inspection allows an acquisition without contact, access to internal and external dimensional information and depending on the reconstruction software a wide range of different analysis methods. [8]
- CT ANALYSIS OF AM PRODUCTS
With the rapid growth of AM technology, some evaluation criteria for processing techniques, processing parameter optimization, quality control and detection of possible discontinuities should be developed. [3] Computed tomography, as non-destructive testing method, is one of the promising techniques for part inspection. The following sections show the most relevant analysis methods based on CT.
4.1 Porosity analysis
With this tool the software detects irregularities because of a deviation of the grey values in one region compared with the local area. Pores with different sizes can be marked in different colours (Figure 5) and statistically analysed obtained to the diameter, volume, surface, frequency distribution or probability.
4.2 Dimensional Measuring
Different measurement tools allow a verification of distances and angles. This is very useful, if it’s necessary to check values on inboard structures.
4.3 Nominal actual comparison
In this analysis the CAD model geometry of the product is getting compared with the result of the CT 3D volume. The deviation can be pictured in different colours or scales.
4.4 Wall thikness analysis
This is a way to analyse the different material thicknesses of the part with a colourful scale as well.
4.5 Limits
CT is an indirect test procedure and measurements e.g. of the size of material faults; of wall thicknesses must be compared with another absolute measurement procedure. Another potential drawback of CT imaging is the possible occurrence of artefacts in the data. Artefacts limit the ability to quantitatively extract information from an image. Therefore, as with any examination technique, the user must be able to recognize and discount common artefacts subjectively. [8]
Like any imaging system, a CT system can never reproduce an exact image of the scanned object. The accuracy of the CT image is dictated largely by the competing influences of the imaging system, namely spatial resolution, statistical noise and artefacts.
Another important consideration is to have sufficient X-ray transmission through the sample at all projection angles without saturating any part of the detector. [8]
During the pursuit to reach a high-resolution CT scan with preferably small voxel should always receive attention on the scanning time and the file size. A reduced scanning time will be to the detriment of the scanning quality but more projections means an increasing memory requirement, particularly with a high-resolution detector with small pixels.
- CONCLUSION
The AM technology is growing unrestricted but there are some limitations include the standardization of the process, qualification of the parts and optimization of the manufacturing process. The motivation to use the opportunities of AM promote the development of qualified inspection techniques. Computed tomography offers a wide range of analysis methods to evaluate such complex structures depending on the application.
In many places different institutes and organisations working on a standardisation for AM products and their qualification. This is needed for an orientation regarding to the right quality control system. But it is difficult to develop one standard for so many different am technologies and possible discontinuities.
- CASE STUDY
A typical defect, as described in 2.1, is the lack of fusion or not adequately heated powder in one or more layers in SLM processes. This can occur because of a wrong parameterization of the printing machine of fluctuations in laser output. These defects are not visible from the outside after printing, because the laser is driving at first a contour path before melting the volume. These are two different parameter sets. In this case just the parameter set of the volume path has been manipulated. It’s not known in which size defects occur, that’s why we did a test with a high-resolution CT to detect these kinds of defects.
The “Günther-Köhler-Institut für Fügetechnik und Werkstoffprüfung” in Jena produced with their SLM 250 HL two test samples made of AlSi10Mg powder and the standard parameter set for aluminium with 325 W laser output. For one of these two samples the laser output was reduced to 225 W over four layers to create an area of defects, the other sample was used as reference. For the CT we used an X-Ray WorX 225 CT microfocus tube and a varex 3025 XRD matrix detector with 100 µm pixel size. For the CT-scan we applied the following parameter: 70 kV, 180 µA, magnification M=13, 1000 projections with 8 integrations. The defect area is already visible in the 2D projections, see figure 9.
With the chosen setup and parameters, we reach a voxel size of 16 µm. Slices of the CT scans are shown in Figure 10. The manipulated section can be separated from the surrounding material on the side view by eye. The top view shows that there are some pores in the reference sample as well, but compared with the manipulated part in smaller number and size.
To quantify this, we applied a porosity analysis, described in 4.1, in similar sized regions of both samples. The software marks the detected pores depending on the pore volume in a colour scale. The 3D view shows the shape, extension and position of the pores inside of the volume, see Figure 11. With this analysis method it’s possible to receive statistical data about the pore size and amount.
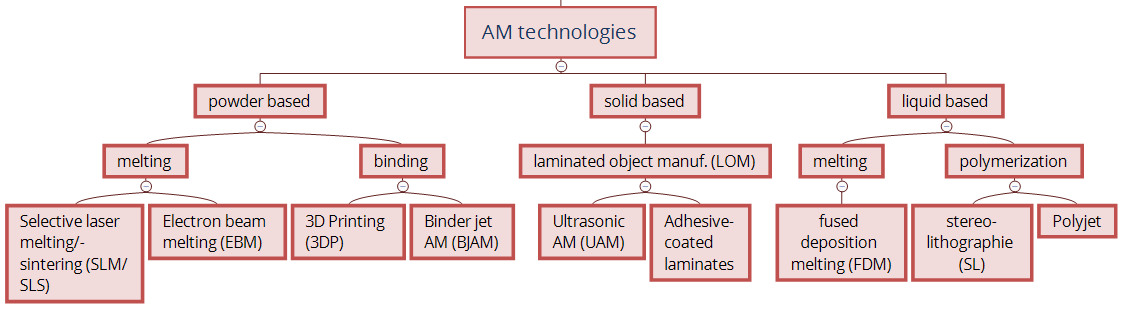
Figure 1. Additive manufacturing process.
![Figure 2. Selective laser sintering. [10]](https://visiconsult.de/wp-content/uploads/2019/02/Figs-2.png)
Figure 2. Selective laser sintering. [10]
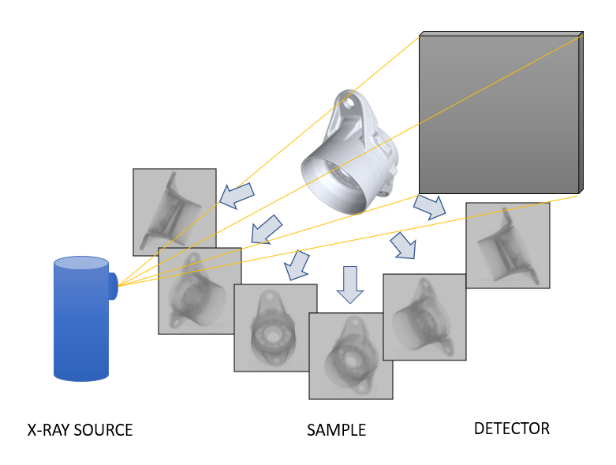
Figure 3. Scheme of a CT scan process.
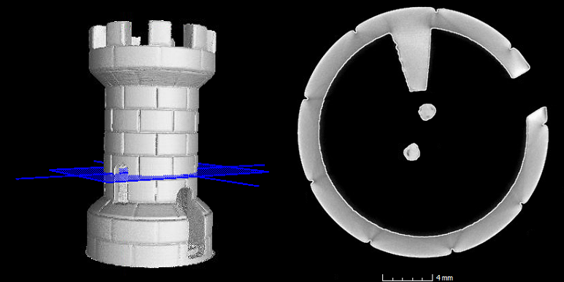
Figure 4. Sample 3D volume and top view of a cross sectional plane.
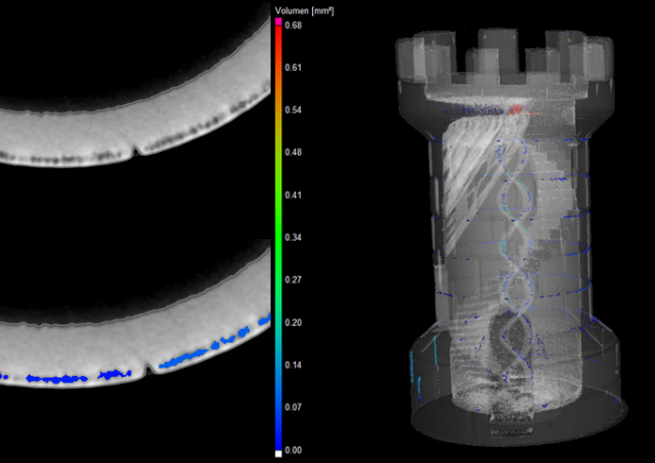
Figure 5. Left: Cross sectional plan without and with marked pores, right: A transparent 3D volume of the AM part with colored pores.
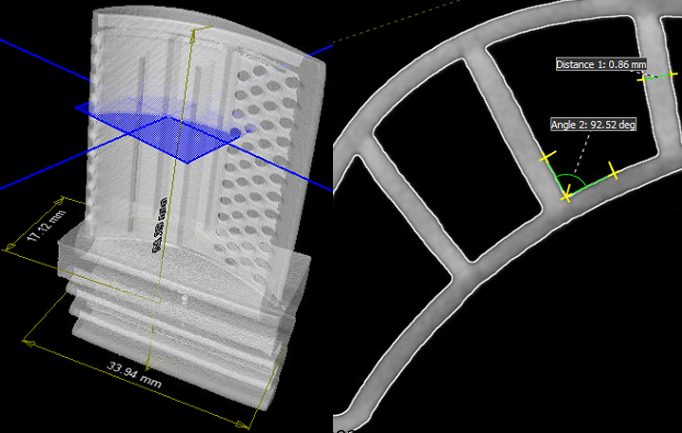
Figure 6. Example of distance and angle measurements in a CT scan.
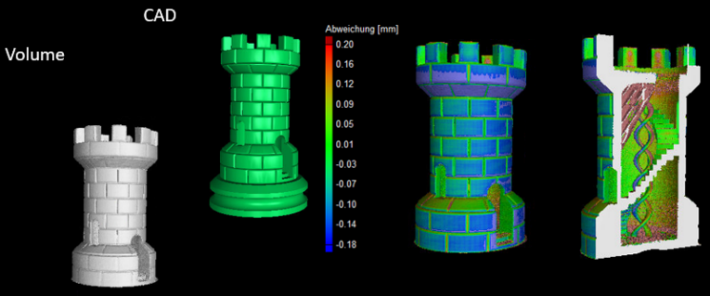
Figure 7. Left: CAD and CT volumes, right: Result of the nominal actual comparison.
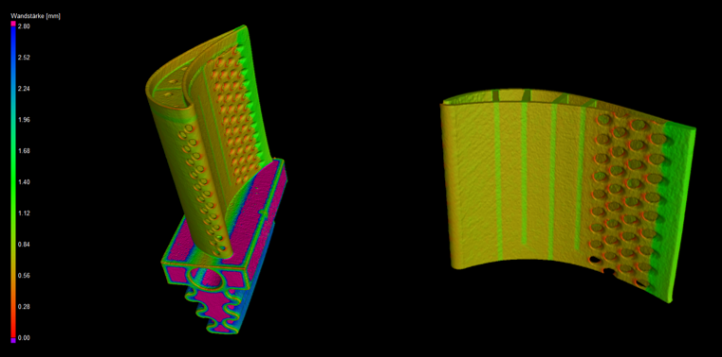
Figure 8. Left: Turbine blade with applied wall thickness analysis.
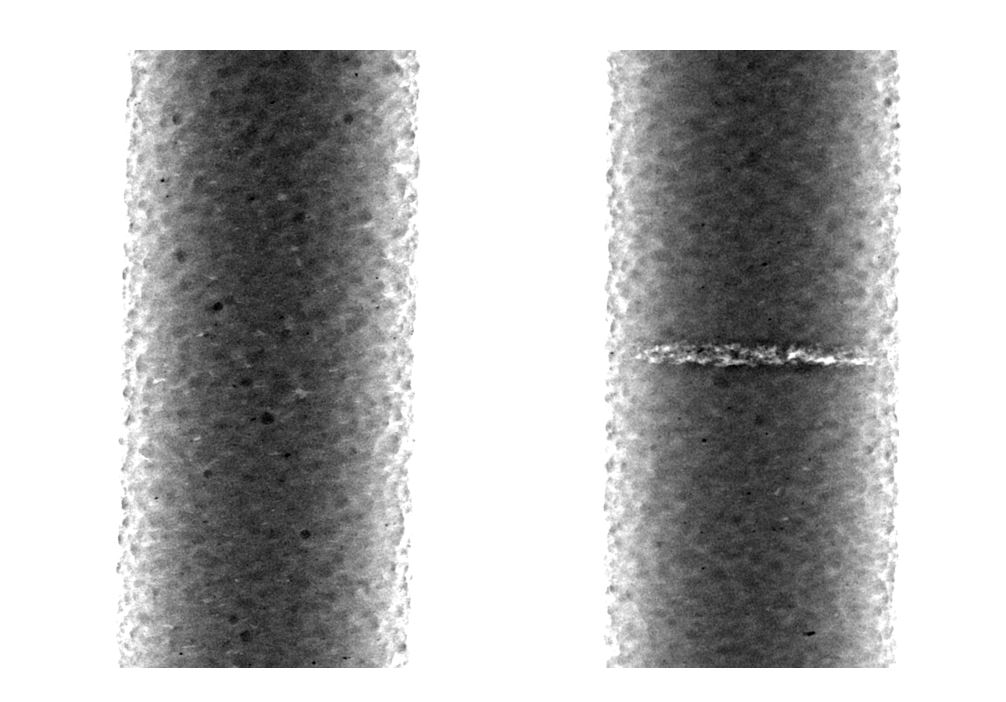
Figure 9. Left: 2D image of reference sample without manipulation, Right: 2D image of manipulated sample with visible area of pores
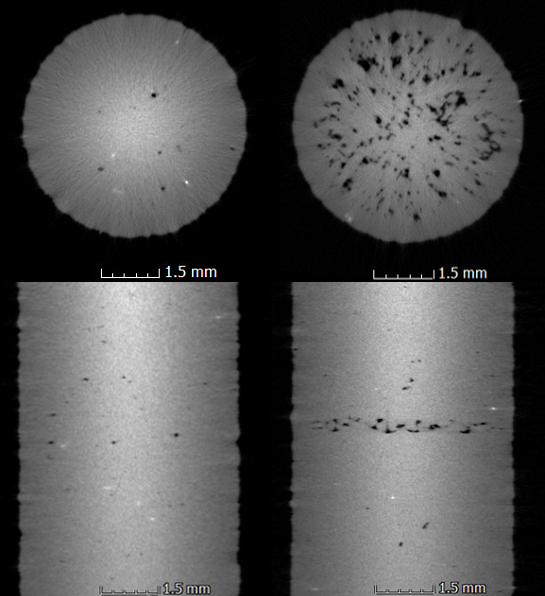
Figure 10. top and side view slice of 3D volume of reference sample (left) and manipulated sample (right)
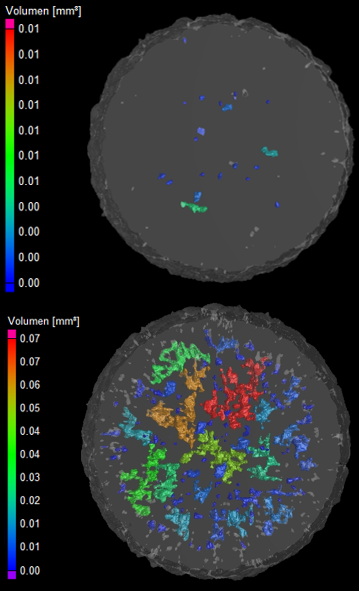
Figure 11. 3D volume with applied porosity analysis of reference (top) and manipulated sample (bottom)
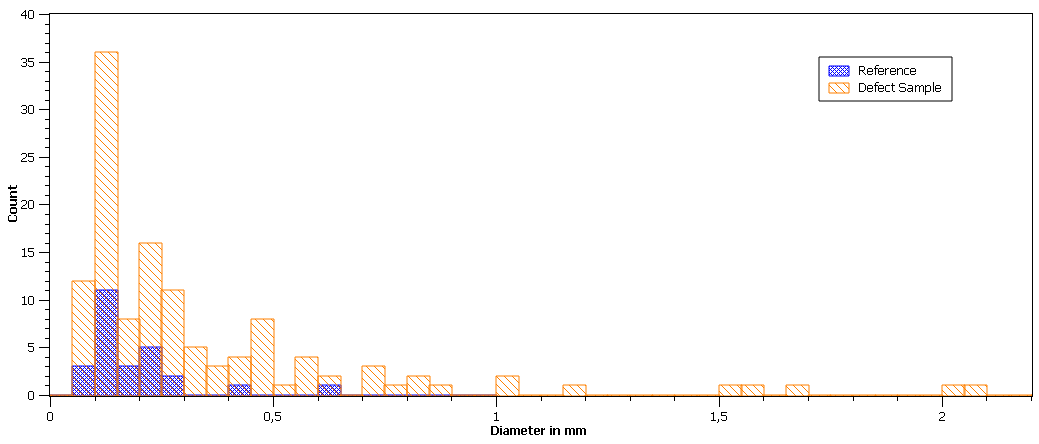
Figure 12. histogram with pore-diameter in mm, blue for the reference and orange for the manipulated sample.